In today’s data-driven world, actionable insights and efficient data management are key to business success. Odoo 18’s Spreadsheet and Dashboard applications introduce cutting-edge features like dynamic pivot tables, advanced charting options, and seamless data imports. These tools empower businesses to organize, analyze, and visualize data with unparalleled ease and precision. Whether you’re tracking performance or planning strategies, Odoo 18 provides the flexibility and integration needed to make smarter, faster decisions. Discover how these updates redefine the way businesses handle data and insights.
Key Features of Odoo 18 Spreadsheet & Dashboard
1. Dynamic Pivot Tables
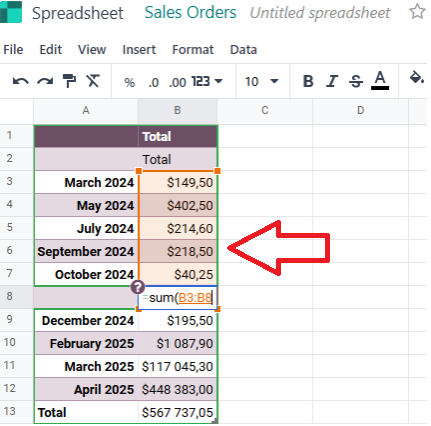
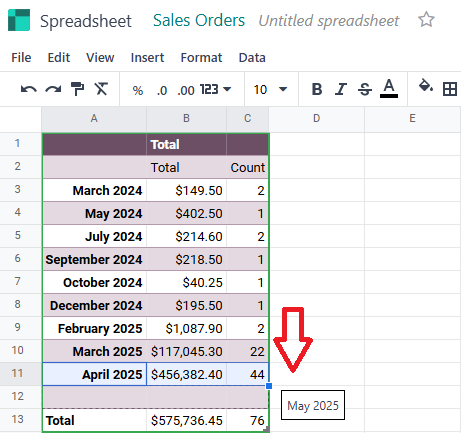
Odoo 18 introduces dynamic pivot tables that adapt to changes in data and layout automatically:
- Dynamic Formulas: The pivot table formula expands or contracts based on available data.
- Array Formulas: Consolidate complex calculations into single, reusable formulas.
- Improved Visualization: New design features allow better presentation of pivot data with less effort.
This ensures that reports are always accurate and up-to-date, even as data evolves.
2. Data Tables for Better Organization
Organize and format data tables with ease:
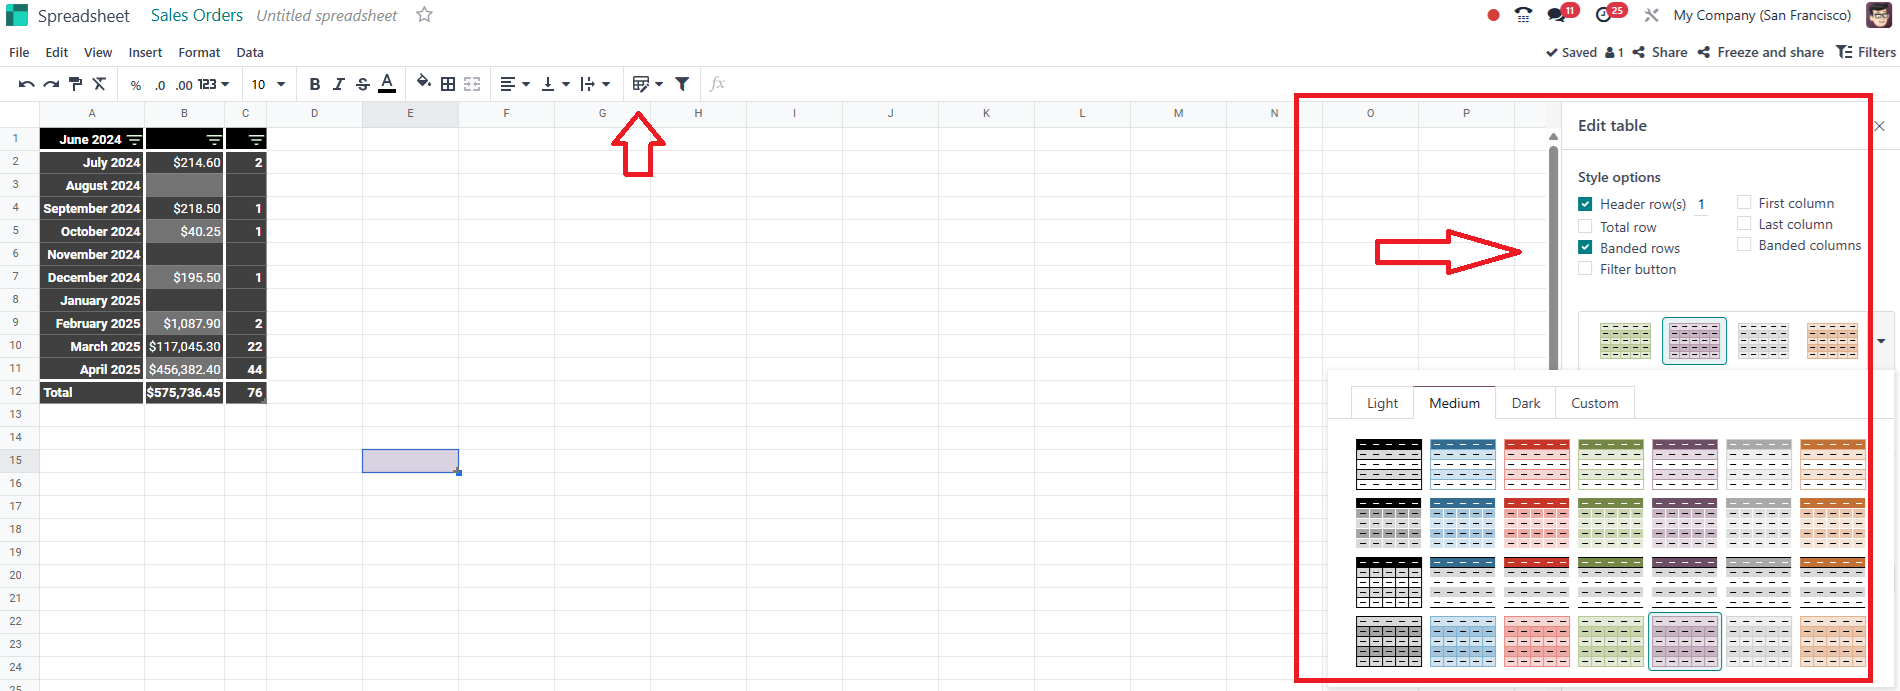
- Pre-Defined Styles: Choose from light, medium, and dark themes or create custom styles.
- Customizable Layouts: Highlight key columns or rows for better visibility.
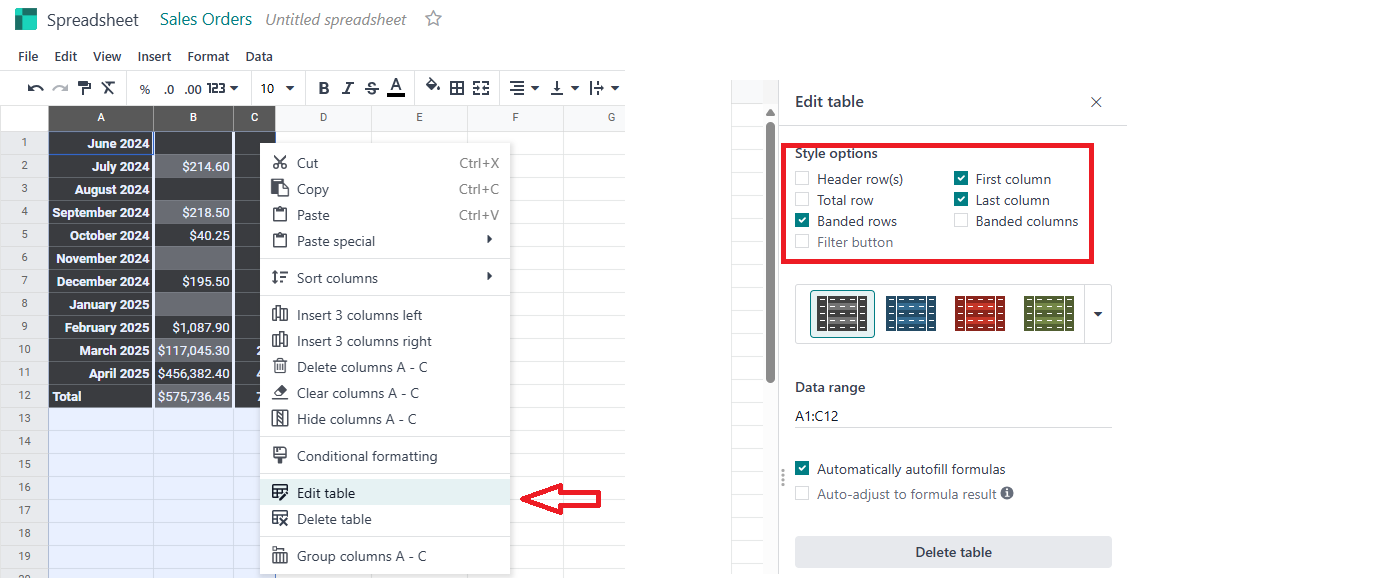
- Effortless Filters: Toggle filters on or off directly within the data table interface.
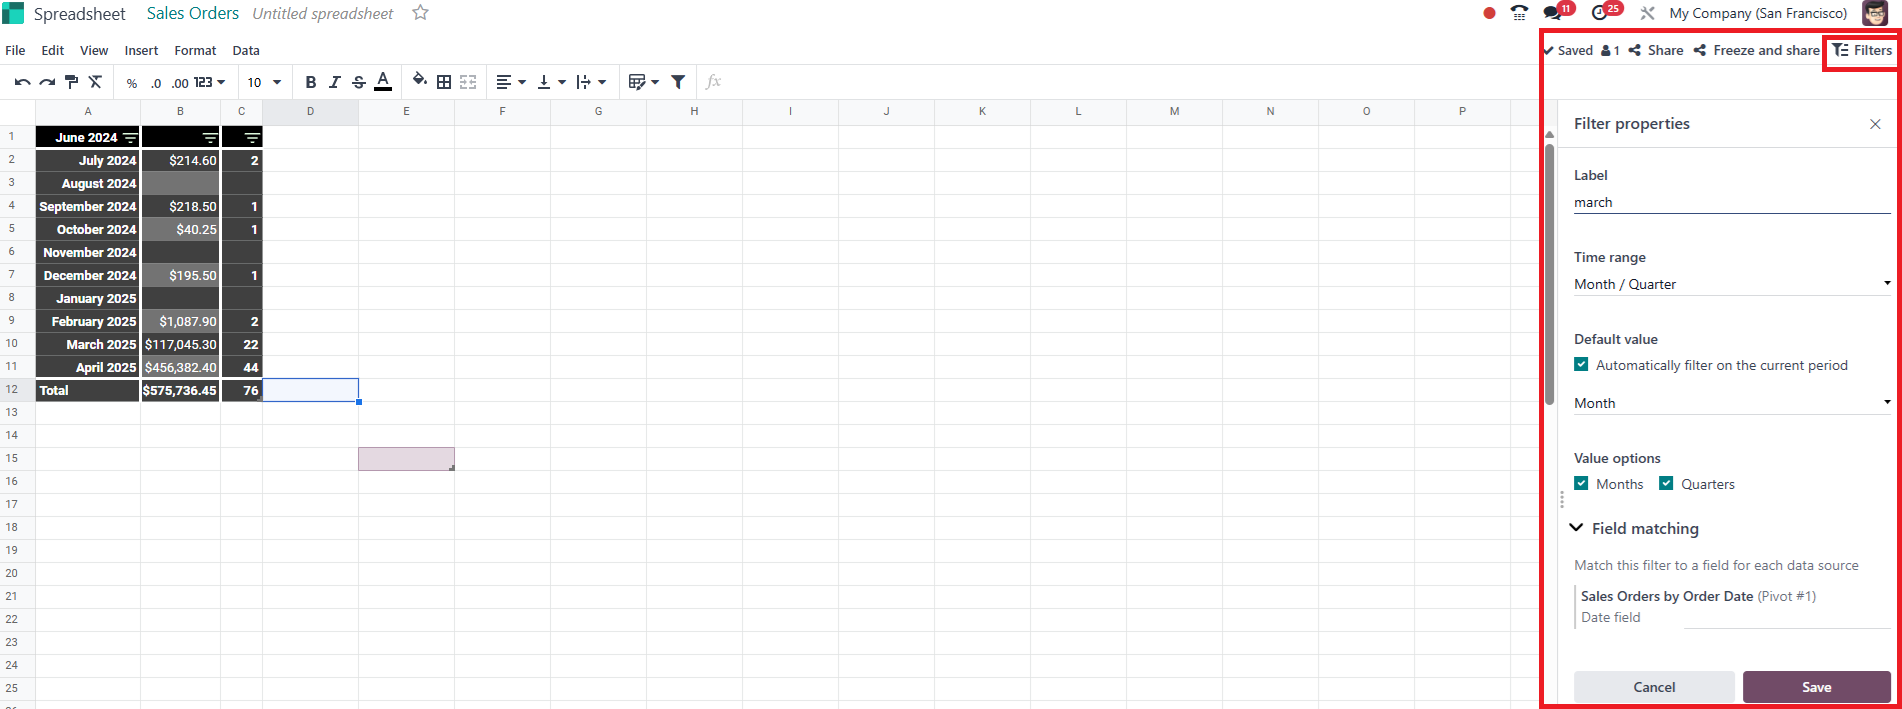
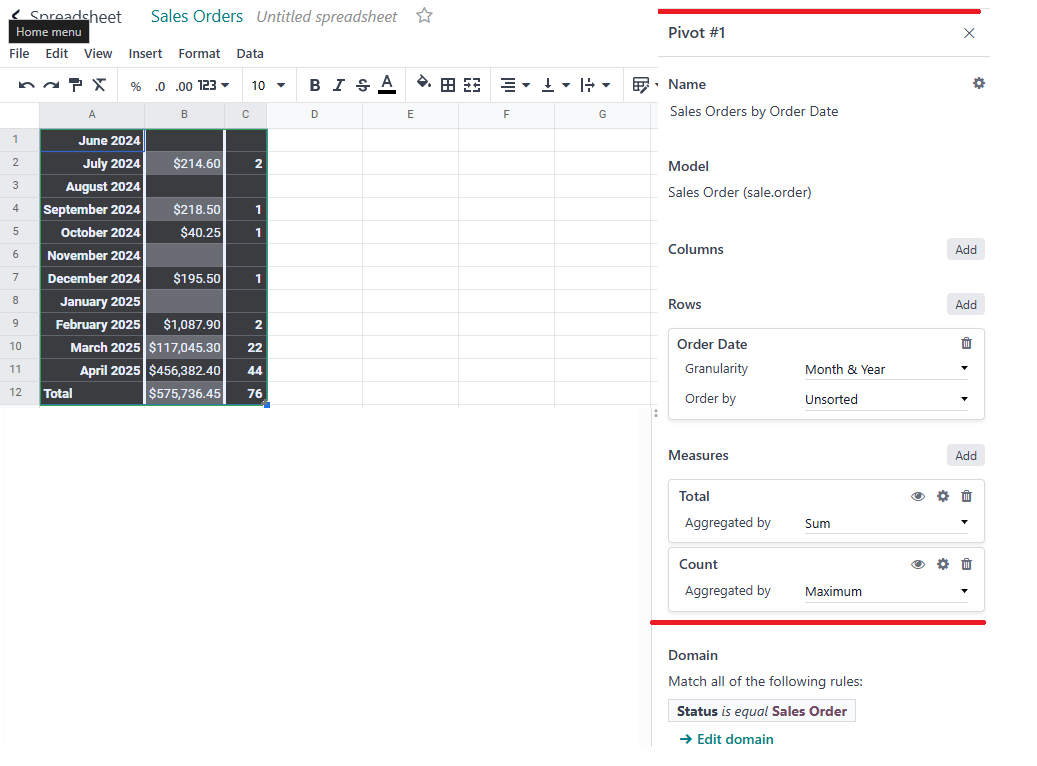
These enhancements make your dashboards more visually appealing and easier to interpret.
3. Advanced Measure Calculations
Create custom measures tailored to your business needs:
- Cross-Sheet Calculations: Use data from other spreadsheets for advanced computations.
- Custom Metrics: Define KPIs such as average revenue or loyalty points directly within the pivot table.
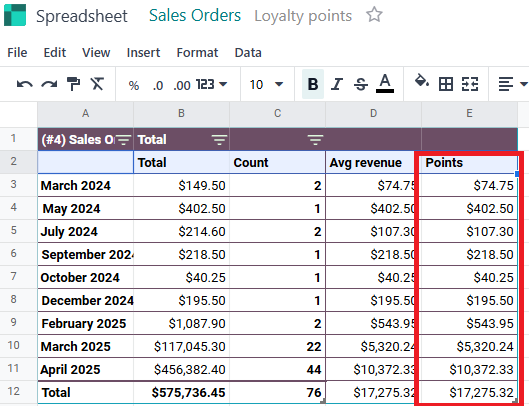
This flexibility enables deeper insights without the need for external tools.
4. Seamless Data Import
Odoo 18 allows direct data import between spreadsheets:
- Copy-Paste Support: Move data between sheets without losing formatting.
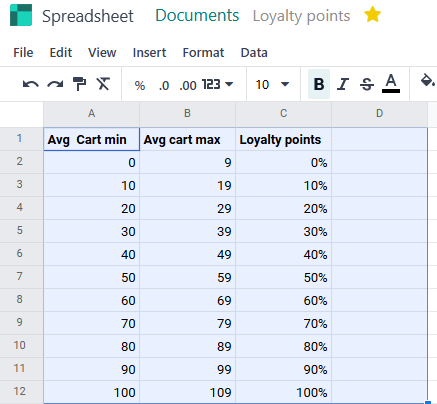
- Integration with Odoo Modules: Pull live data from sales, inventory, and other apps into spreadsheets.
This eliminates manual data entry, saving time and reducing errors.
5. Enhanced Charting Options
Create impactful visualizations with new chart types:
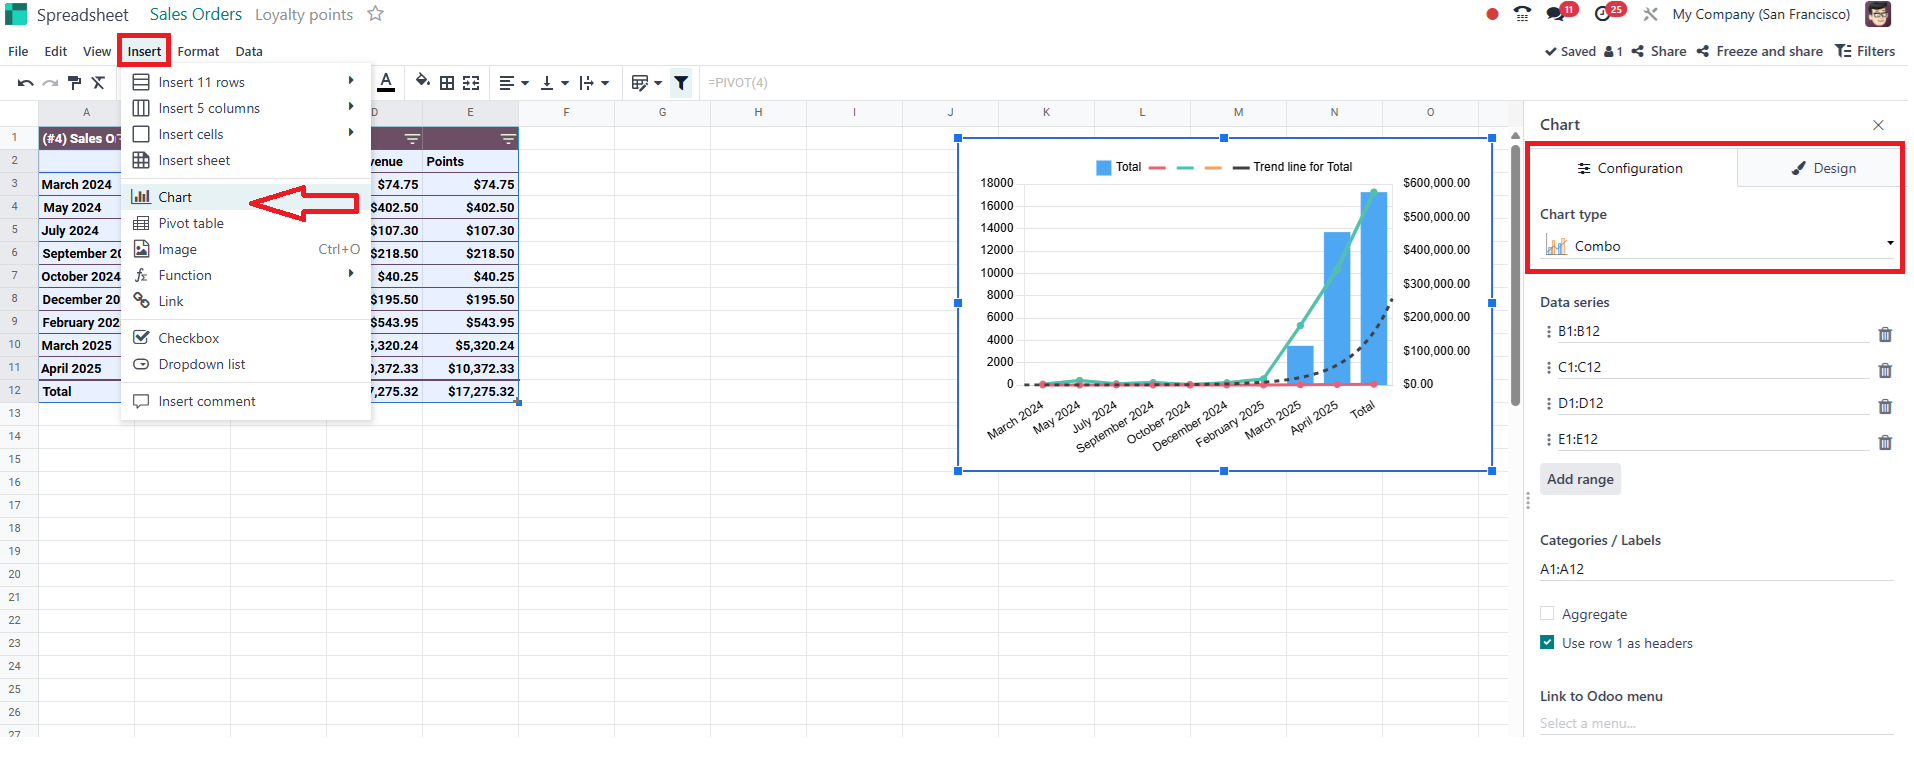
- Combo Charts: Combine bar and line graphs to compare metrics effectively.
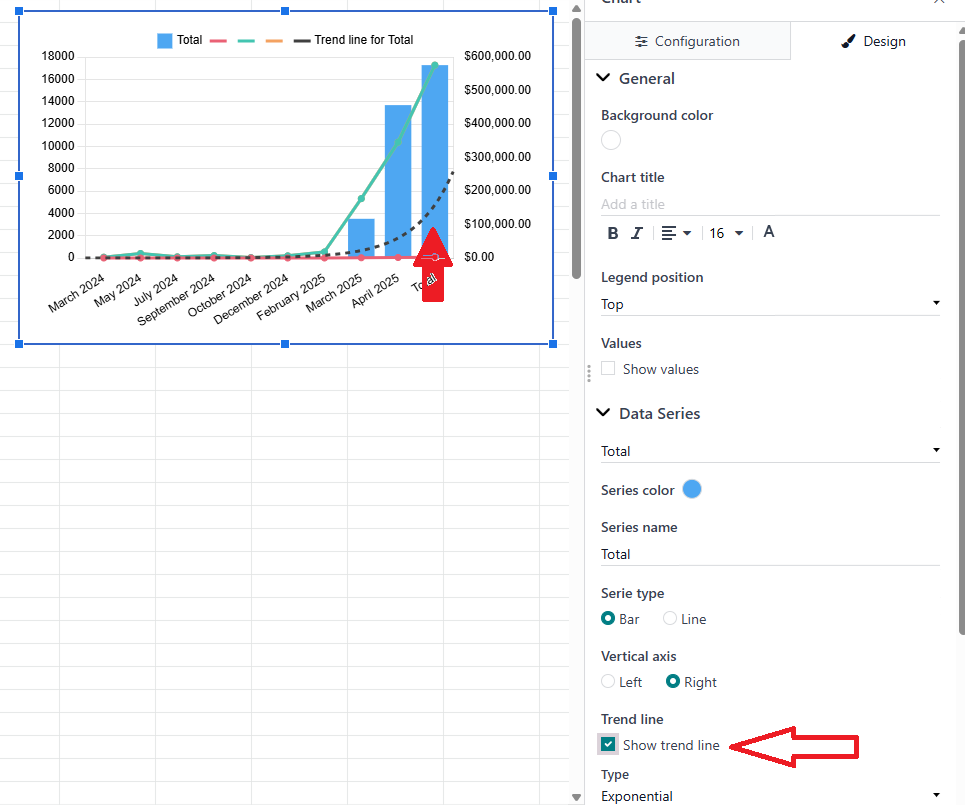
- Trend Lines: Add linear, exponential, or polynomial trends to analyze past performance.
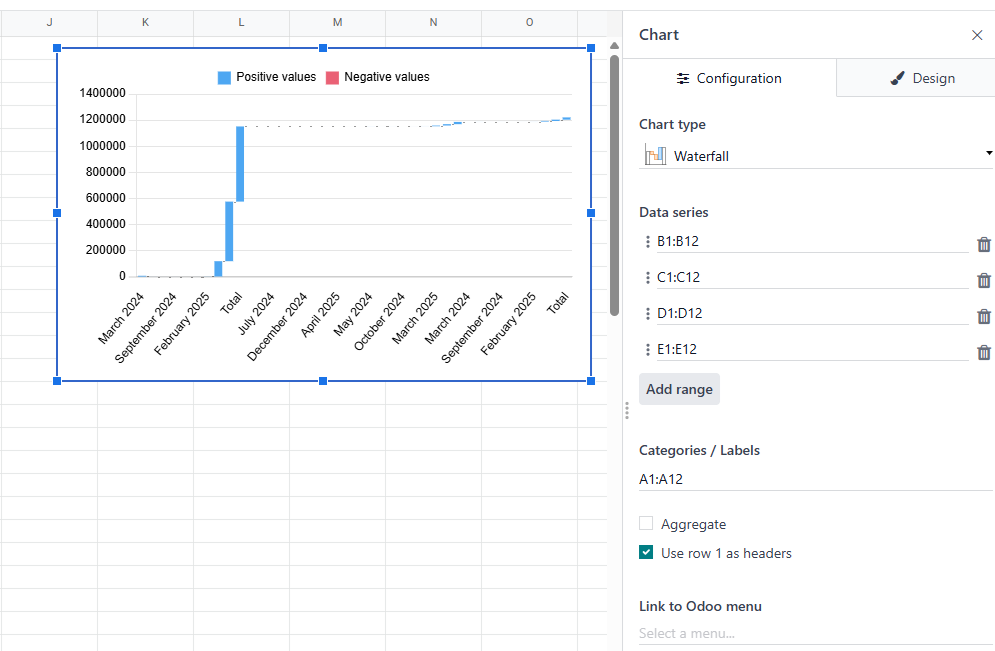
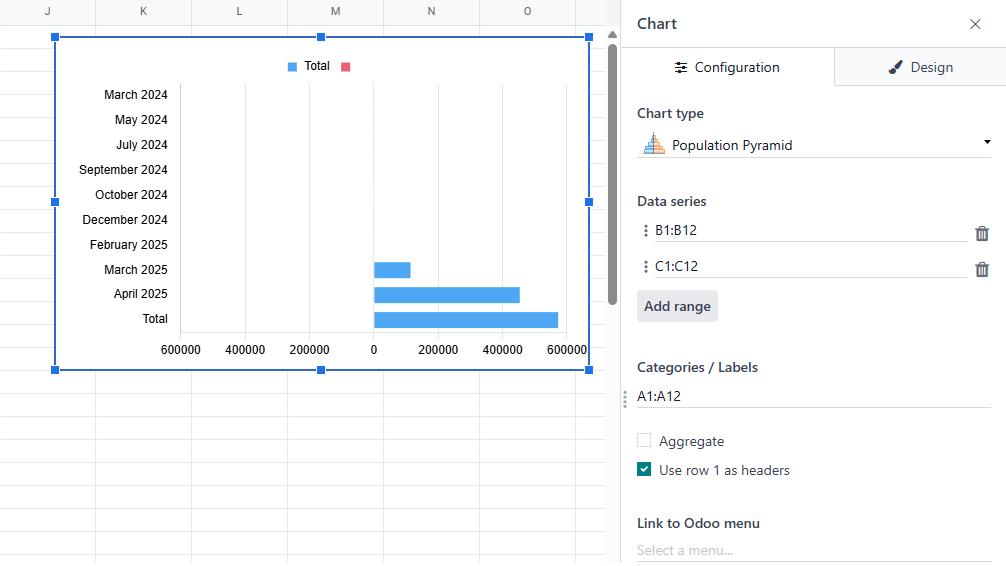
- Population Pyramids and Waterfalls: Display demographic or financial data innovatively.
These tools make presenting complex data more straightforward and impactful.
6. Collaboration and Annotation Features
Improve teamwork and feedback loops:
- Integrated Chatter: Discuss changes directly on the spreadsheet.
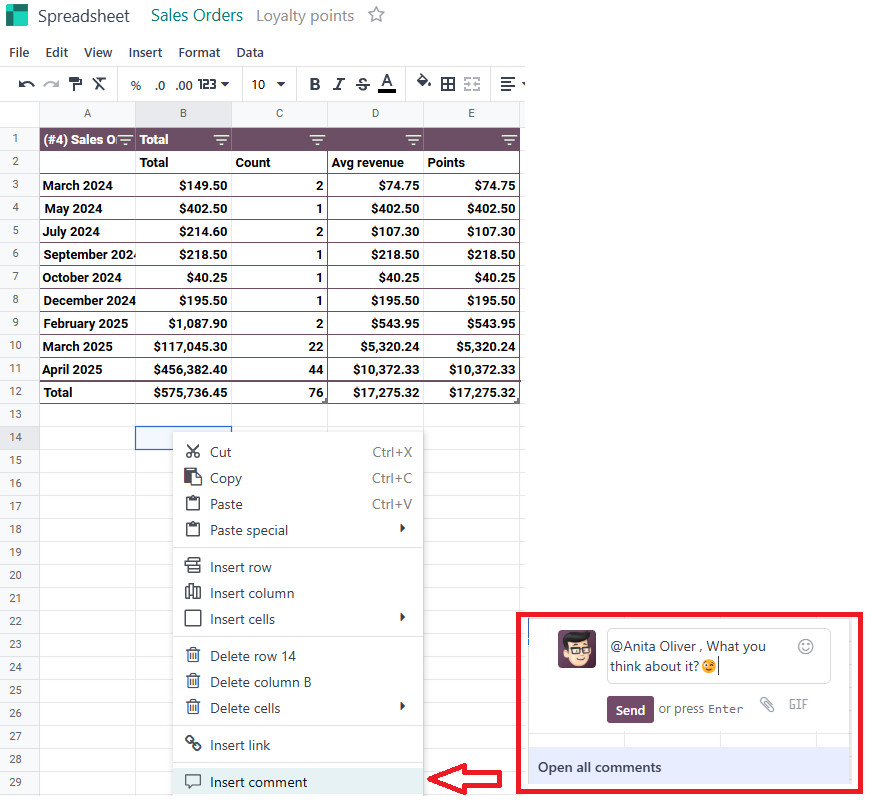
- Version History: Track and restore previous spreadsheet versions effortlessly.
- Conditional Formatting: Highlight progress or issues using data bars based on metrics.
These features enhance communication and help align team efforts.
Why Choose Odoo 18 Spreadsheet & Dashboard?
The new Spreadsheet and Dashboard features in Odoo 18 make data management seamless, visually compelling, and deeply integrated. With dynamic pivots, advanced analytics, and improved visualization tools, businesses can generate insights faster and act with greater confidence.
Conclusion
Odoo 18 takes spreadsheets and dashboards to the next level, offering features that save time, enhance collaboration, and deliver actionable insights. Whether you're managing daily operations or planning for the future, these tools help you make smarter, data-driven decisions.

